
The Velocity Throttle: Save a Subscription Model by Charging Less
The Inversion at a Glance (24-Month Impact)
- The Pricing Pivot: Scrapped the $79 "all-you-can-eat" flat fee for a $10 micro-membership + $15 per use.
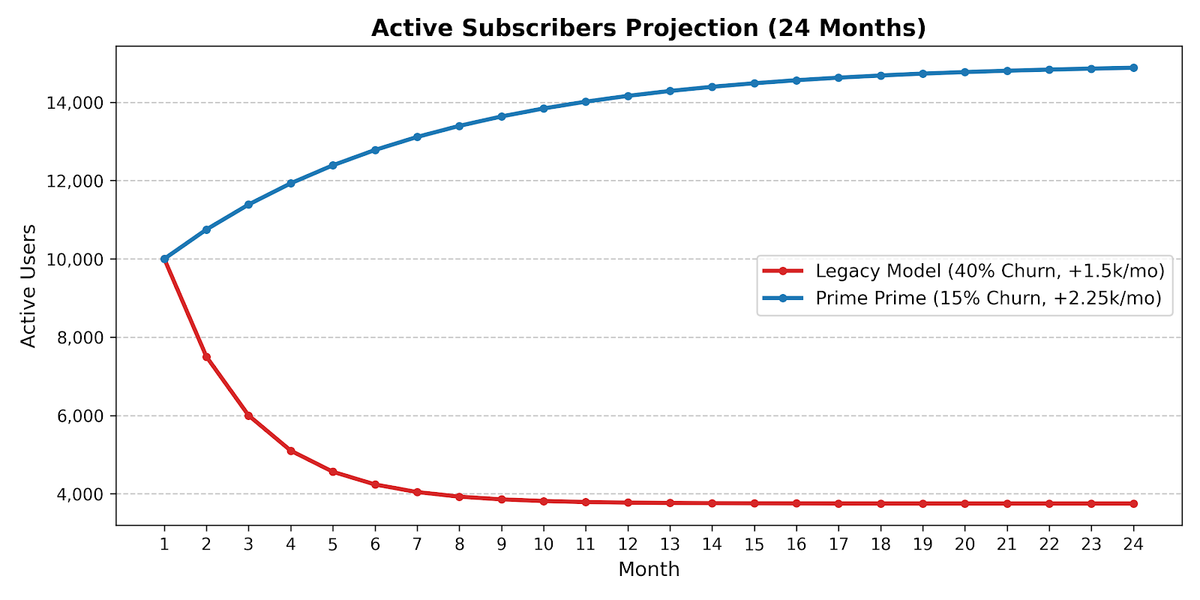
- The Churn Collapse: Fatal 40% monthly churn plummeted to a highly sustainable 15%.
- The Scale: Instead of collapsing to a mathematical ceiling of 3,750 users, the active user base compounded to nearly 15,000.
- The Revenue Win: Despite a 64% lower entry price, cumulative top-line revenue increased from $8.3M to $9.1M+.
- The Operational Rescue: The newly introduced "velocity throttle" caused physical inventory to survive 4x longer, drastically slashing deferred COGS and preserving real gross margin.
Part 1: The Architecture of a Subsidized Treadmill
At a previous venture, we were running a standard $79/month unlimited clothing subscription. On the surface, growth was strong. But the foundation was flawed. Our churn was hovering at a fatal 40-60%.
The conventional wisdom in the boardroom was to "market our way out of it." The belief was that the funnel just needed more volume. But as a systems architect, I knew we didn't have a marketing problem; we had a foundational business physics issue.
Our best customers (power users) were bleeding our logistics dry, while our casual users—the critical base that provides stable margin—were canceling due to "subscription fatigue." They felt guilty paying $79 for a service they barely used.
To fix it, we first had to tear down the exact variable cost (VC) floor of a single transaction: a box of three garments.
The True Cost of Fulfilling One Box
We isolated the granular expenses required to move three pieces of clothing round-trip through the system:
- Outbound Shipping (Commercial Plus): $8.75
- Return Shipping: $8.75
- Cleaning (Blended Avg): $1.88
- Restocking Labor: $1.50
- Total True Variable Cost (VC): $20.88 per box
Under the legacy $79 unlimited model, a user doing the average velocity of 3 cycles a month was costing us $62.64 in direct variable costs. While that left a razor-thin $16 margin, it did not account for garment depreciation or Customer Acquisition Cost (CAC). When churn is 60%, you never recover CAC. The system was a localized, unstable architecture that rewarded overuse.
We had to kill the unlimited model.
Part 2: The Inversion (Defining "Prime Prime")
We introduced a strategic pivot that I call the "Prime Prime" model. We did not just change prices; we flipped the business's foundational economics by decoupling access from utilization.
We replaced the high-friction $79 flat rate with a two-tier gate structure:
- A $10 Monthly Membership Fee (Access)
- A $15 Pay-As-You-Go Box Fee (Utilization)
To a traditional retail analyst, this looked like suicide. We were slashing our top-line revenue per user from $79 to $28 (assuming 1.2 boxes). But structurally, we fundamentally altered the risk profile of the entire enterprise.
Part 3: The Behavioral Physics: Deploying the "Velocity Throttle"
The magic of the "Prime Prime" inversion wasn't just in the margin mathematics; it was in the psychological effect of a transactional fee.
By introducing a per-box fee, we created an active Velocity Throttle. Users no longer felt guilty for not ordering 3 boxes a month; they only ordered when they actually needed the inventory. This transactional friction naturally throttled utilization velocity down from 3 boxes a month to ~1.2 boxes a month.
Look at the new gross margin profile for a user ordering 1.2 boxes:
- Monthly Revenue (ARPU): $10 base + (1.2 × $15) = $28.00
- Monthly VC Cost: 1.2 boxes × $20.88 = $25.06
- Monthly Gross Margin: +$2.94
Why is a $2.94 margin better than a $16 margin? Because we were finally profitable across the entire user base, and most importantly, removing the high-friction commitment of a $79 monthly charge caused our fatal churn rate to plummet from 40% down to just 15%.
Part 4: The 24-Month Reversal (The Math of Scale)
To model the structural inversion, we locked in a strict set of baseline operational variables. Both models start with the exact same active user base, but are subject to the distinct mathematical realities of their respective pricing architectures.
| Input Variable | Legacy ($79/mo) | Prime ($28/mo) |
|---|---|---|
| Starting Cohort | 10,000 Users | 10,000 Users |
| Monthly Replenishment (New Subs) | + 1,500/mo | + 2,250/mo (Lower friction) |
| Monthly Churn Rate | 40% | 15% |
| User Velocity (Boxes/mo) | 3.0 | 1.2 (The Throttle) |
| Gross Margin per User | $16.36 | $2.94 |
The Cohort Terminal Velocity Paradox
Every subscription model eventually hits a mathematical ceiling—its steady-state steady-state steady-state steady-state steady-state steady-state steady-state steady-state steady-state steady-state terminal limit—where the number of churning users perfectly equals the number of new acquisitions.
The Steady-State Equation:
- Legacy Steady State (The Cliff): 1,500 new users / 0.40 churn = 3,750 maximum users.
- Prime Prime Steady State (The Climb): 2,250 new users / 0.15 churn = 15,000 maximum users.
Because the Legacy model's ceiling (3,750) is significantly lower than the starting cohort (10,000), it is mathematically forced to collapse downward until it hits its floor. Because the Prime Prime ceiling (15,000) is higher, it is mathematically guaranteed to compound and climb.
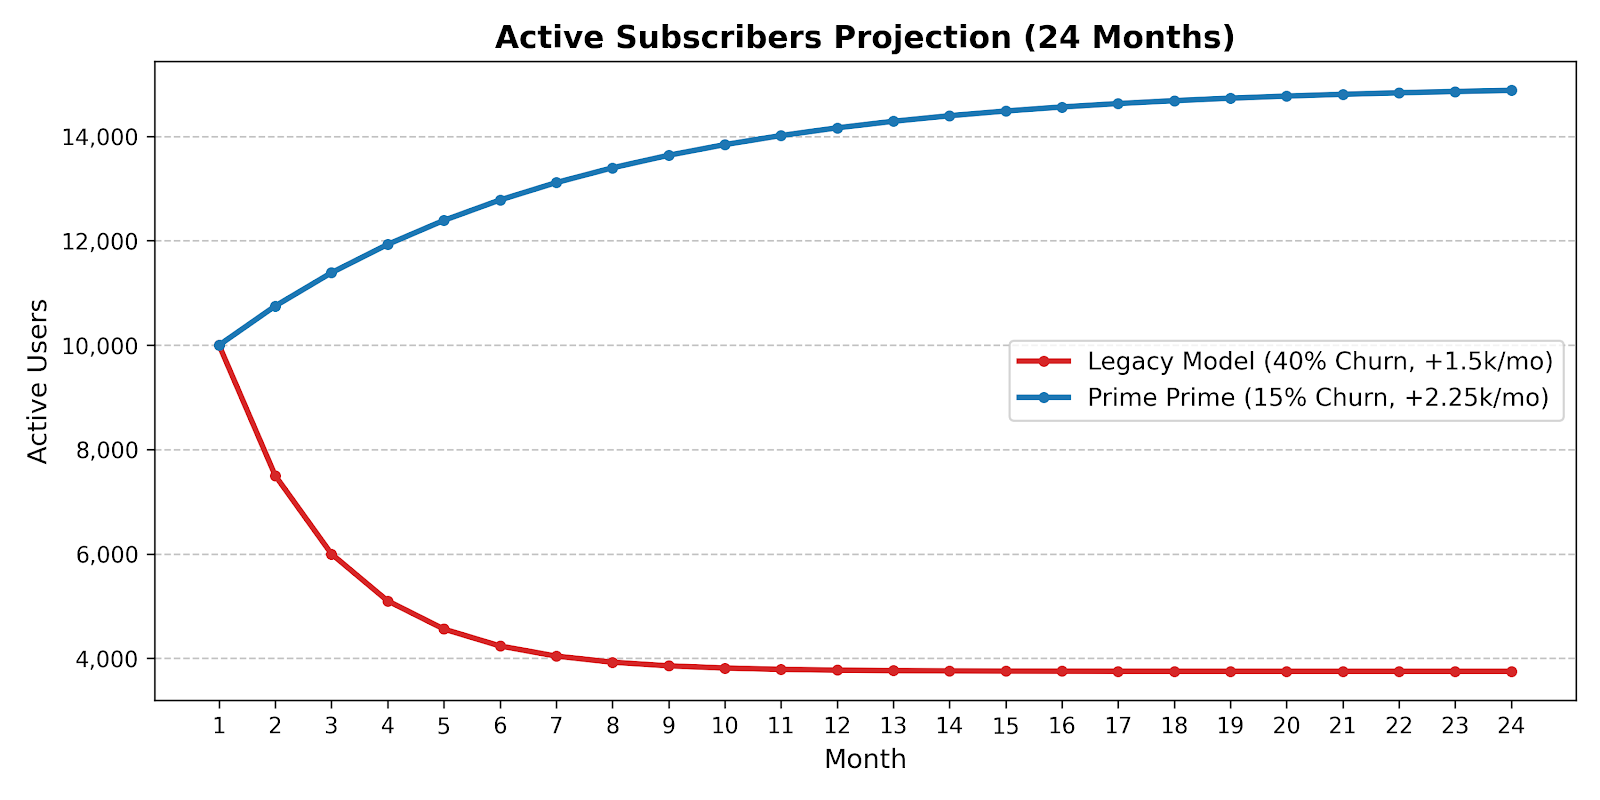
| Month | Legacy Subs (40% Churn) | Legacy Rev ($79/mo) | Prime Subs (15% Churn) | Prime Rev ($28/mo) |
|---|---|---|---|---|
| Month 1 | 10,000 | $790,000 (Vanity) | 10,000 | $280,000 |
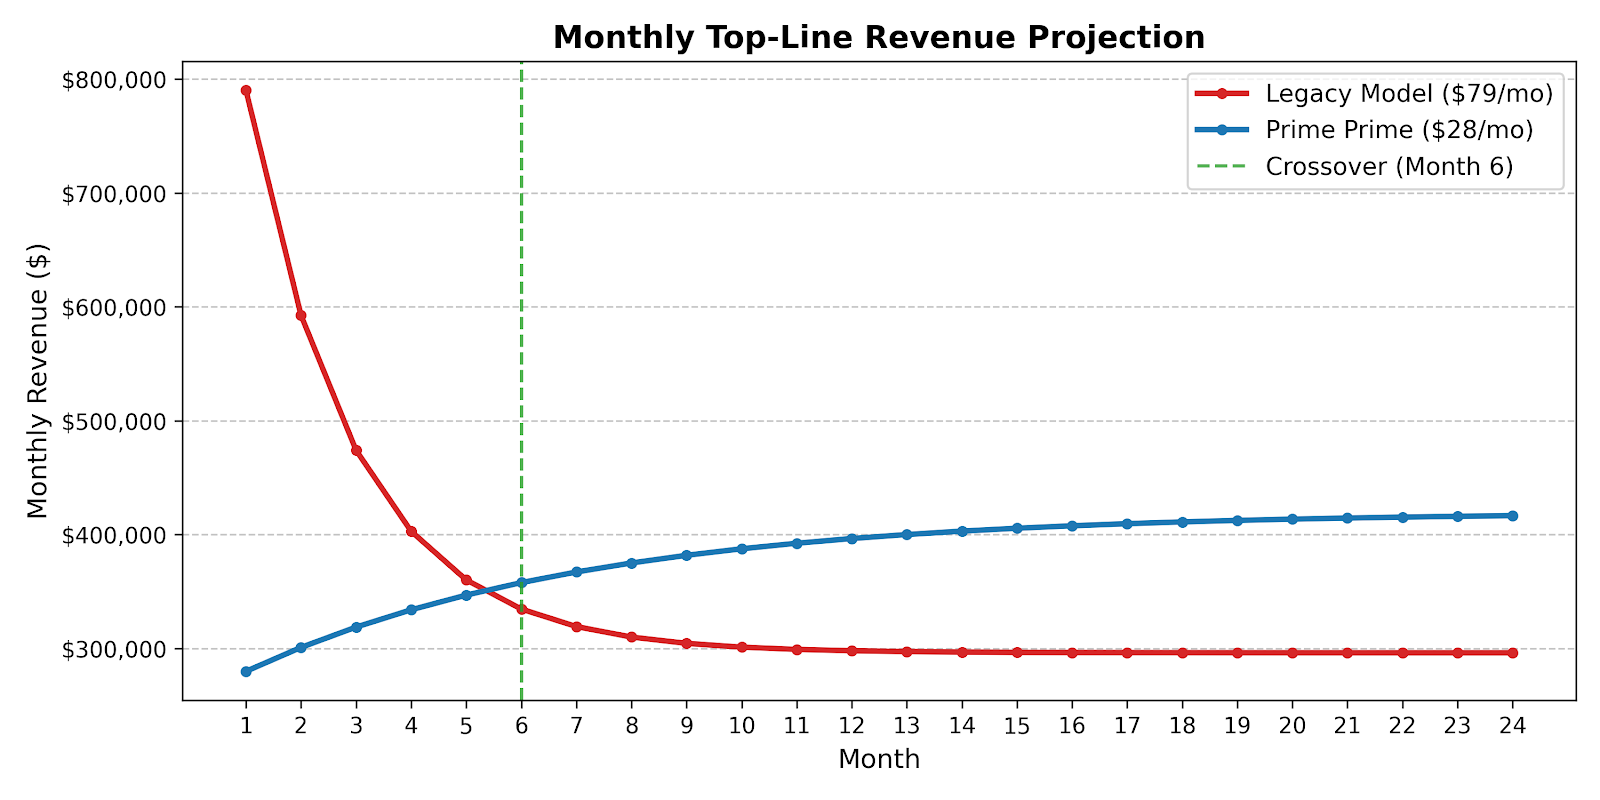
| Month 6 | 4,236 | $334,644 | 12,781 | $357,868 (Crossover) |
| Month 12 | 3,773 | $298,067 | 14,163 | $396,564 |
| Month 24 | 3,750 (Floor) | $296,250 | 14,881 (Compounds) | $416,668 |
The Price of Patience (Cumulative Revenue)
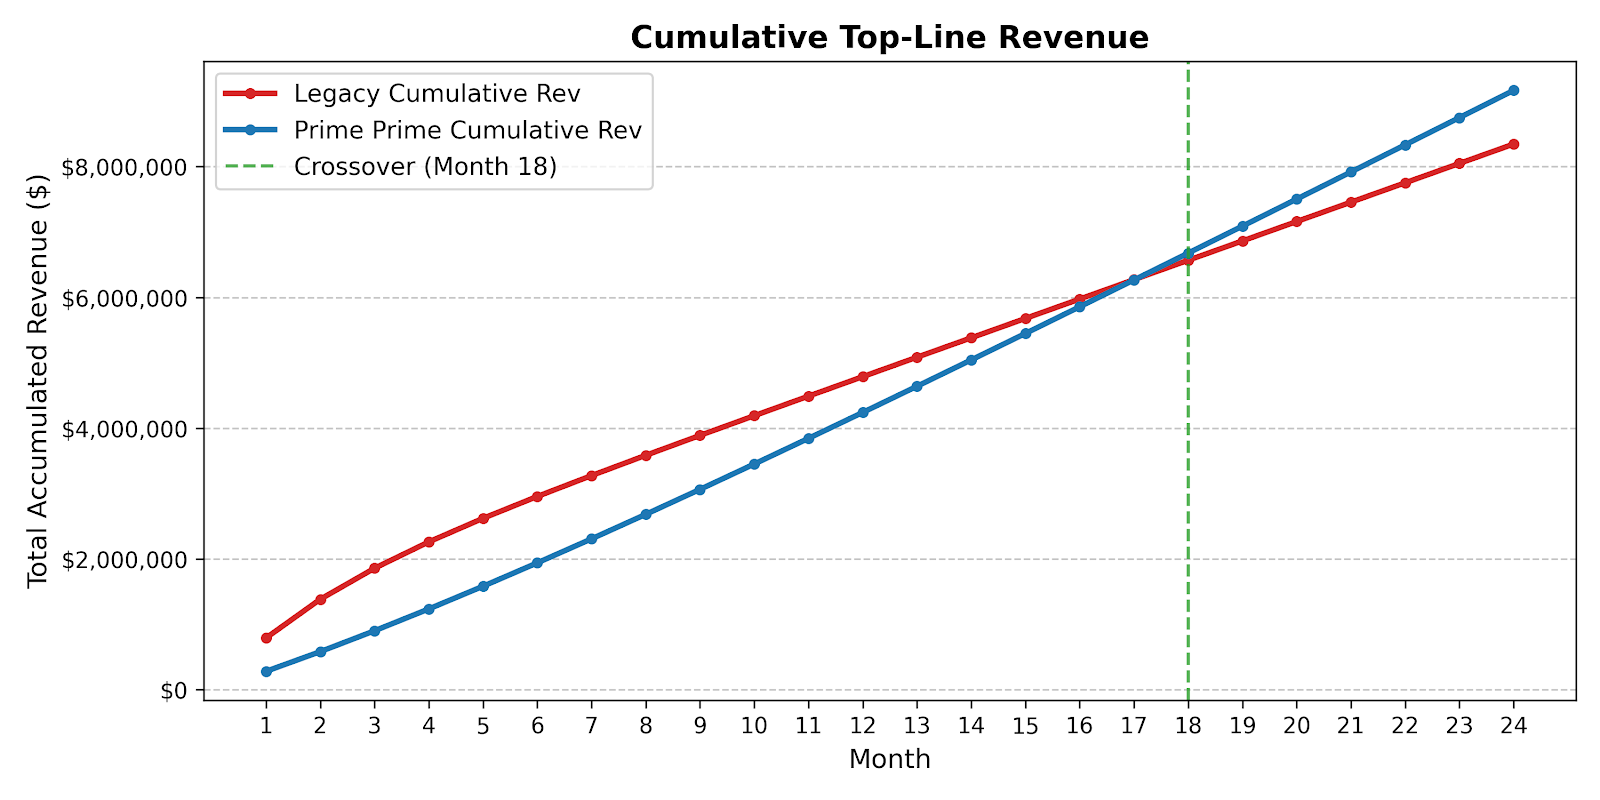
While the monthly revenue crosses over at Month 6, the cumulative top-line cash paints a fascinating picture of executive patience. For the first 17 months, the legacy model generates more total cash. This is the "Executive Mirage" that terrifies boards from changing pricing.
But by Month 18, the compounding retention of the $28 model finally outpaces the massive front-loaded cash grab of the legacy model. By Month 24, Prime Prime hasn't just caught up; it has generated **~$9.1 million** in total top-line revenue compared to the legacy model's ~$8.3 million. From Month 24 onward, the gap only widens.
Part 5: The Gross Margin Trap: Why "Vanity Profit" Bankrupts Companies
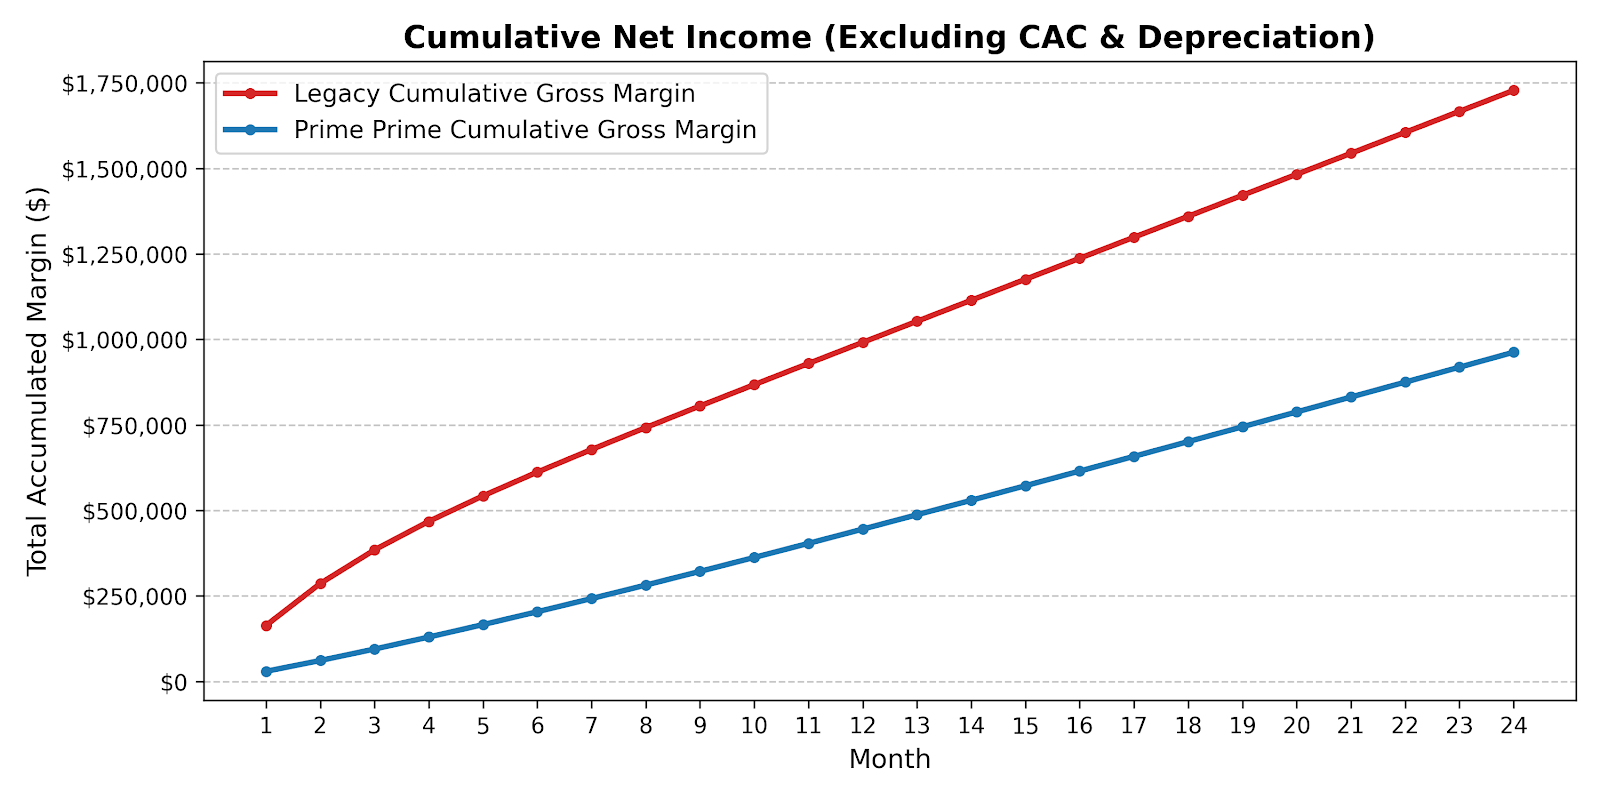
At first glance, the cumulative net income chart appears to tell a story of sacrifice. Over 24 months, the Legacy model accumulates significantly more raw Gross Margin in a vacuum ($1.72M vs Prime's $963K). A traditional financial analysis would stop here and declare the pivot a failure.
But this is where the mirage leads to insolvency.
To generate that $1.72M, the legacy system is subjected to two massive, invisible stresses:
- The Inventory Death Clock: The legacy model had to fulfill over 147,000 boxes across a collapsing user base. Garments reached their 5-cycle end-of-life three times faster. The capital expenditure (COGS) required to replenish that destroyed inventory effectively erases the Legacy model’s margin lead.
- The Acquisition Treadmill: The Legacy model required 36,000 new customers to be acquired over two years, just to finish with a measly 3,750 active users. The marketing spend required to replace 32,000 churned users obliterates that $1.72M "profit."
In the Legacy model, you are a logistics company drowning in your own success. In the Prime Prime model, you are a scalable platform.
The projections above are deliberately conservative. We modeled a modest 50% increase in acquisition efficiency for the new model (2,250 new users vs. 1,500).
In reality, dropping the initial purchase friction from a $79 commitment down to a $10 micro-membership drastically reduces your Customer Acquisition Cost (CAC).
In a live market environment, a $10 entry point often yields a 2x to 3x reduction in CAC. If we applied real-world CAC efficiencies to this model, the revenue crossover wouldn't happen in Month 6—it would happen in Month 3, and the cumulative cash gap would close significantly faster.
The Unconventional Strategy Takeaway
By Month 6, the "cheap" $28 model overtakes the $79 model in total cash generation. More importantly, it achieves this while shipping 60% less physical inventory, radically reducing garment wear-and-tear and deferred capital expenditure.
Fixing a failing subscription business is not about top-of-funnel marketing or localized cost-cutting. It is about understanding the fundamental business physics and engineering an inverted system architecture that lets the math work for you instead of against you.
The framework presented above is a synthesized abstraction based on real operational data from a fashion rental startup. To clearly demonstrate the exact mathematical mechanism that reverses a collapsing net-income curve, we intentionally isolated the core variables and applied extremely conservative acquisition multipliers.
A true production model encompasses a deeper matrix of operational realities—including carrier zone shipping variations, seasonal utilization spikes, granular garment salvage values, and dynamic CAC payback periods.
However, the foundational physics remain absolute: if your unit economics are structurally inverted, no amount of marketing efficiency will save the system.
Conversely, when you fix the unit economic floor, the natural reduction in CAC acts as an accelerant, making the real-world results far more aggressive than the baseline modeled here.