
The Asset-Velocity Trap: Flipping Fast Fashion into a B2B Cash Machine
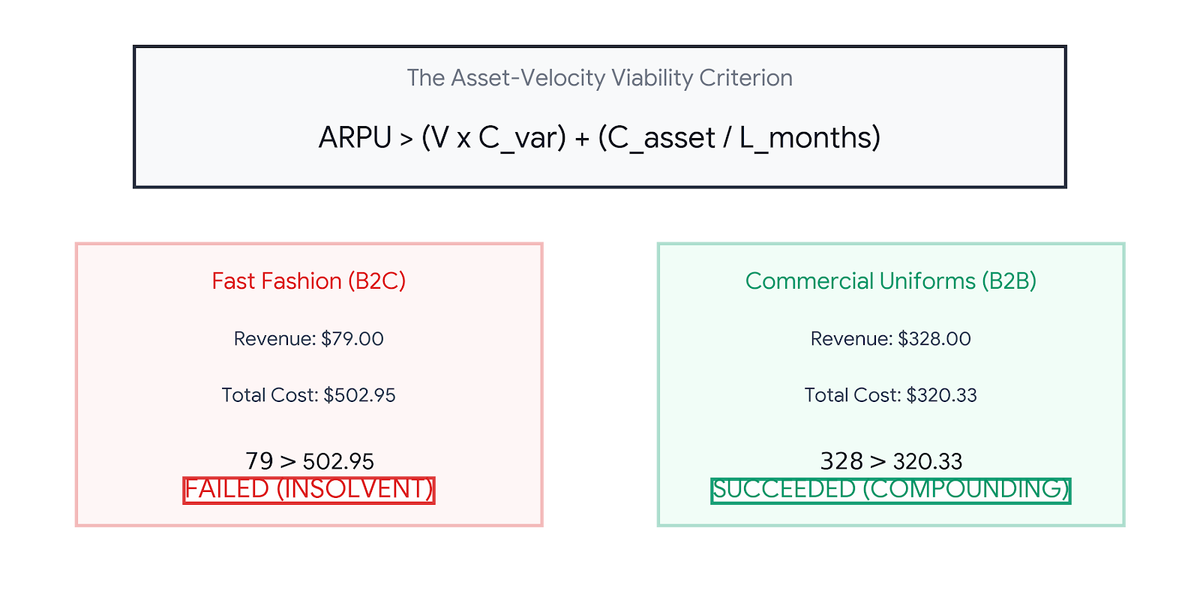
The Inversion at a Glance
- The Structural Pivot: Scrapped the $79 B2C fashion subscription for a $3/garment B2B commercial uniform lease.
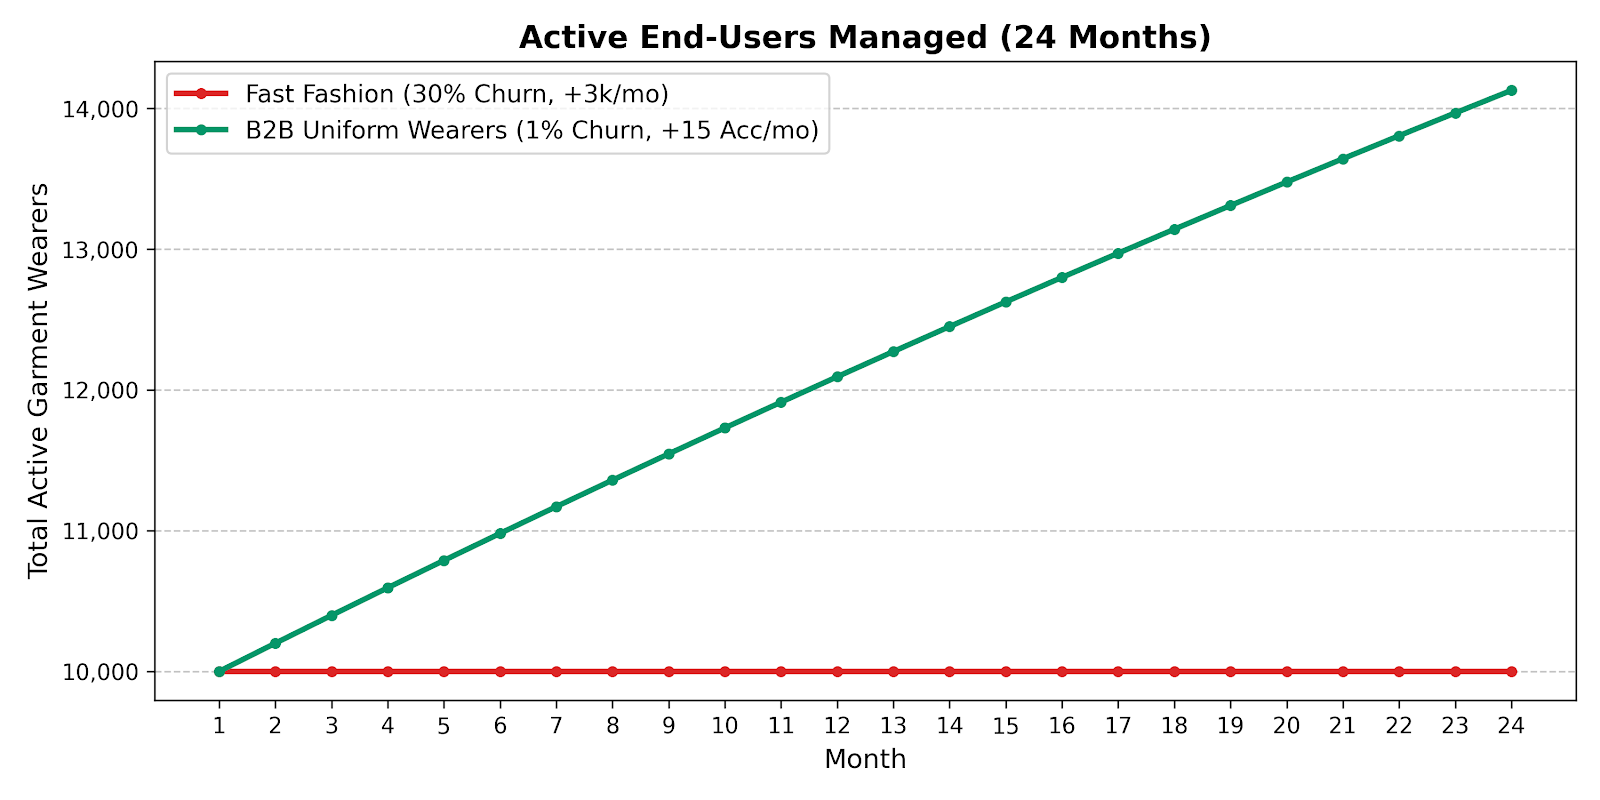
- The Churn Collapse: Fatal 30% monthly B2C churn was replaced by 3-year commercial contracts, dropping monthly churn below 1%.
- The Asset Lifespan: Garment survival increased from a fatal 3 wash cycles to a highly profitable 70 wash cycles.
- The Logistics Rescue: Transitioned from scattered, expensive residential shipping to highly dense, low-cost commercial truck routes.
- The Behavioral Economics: Implemented a $5 upfront setup fee, forcing client "Skin in the Game" to eliminate the capital expenditure payback trap.
Part 1: The B2C Fast Fashion Illusion
On paper, a $79/month fast-fashion rental subscription looks brilliant. You buy the inventory once and rent it out infinitely.
But when you tear down the unit economics to the absolute variable floor, the business mathematically fails before you even account for marketing, overhead, or warehouse rent.
Let’s look at the cost to fulfill a single box of three garments for a power user demanding three shipments a month.
1. The Logistics Floor
- Round-Trip Shipping: $17.50 ($8.75 outbound + $8.75 return)
- Handling per Box: $9.75 (3 garments × [$1.75 receiving + $0.75 OB + $0.75 IB])
- Individual Dry Cleaning: $5.40 (3 garments × $1.80)
- Total Variable Cost (VC) per Box: $32.65
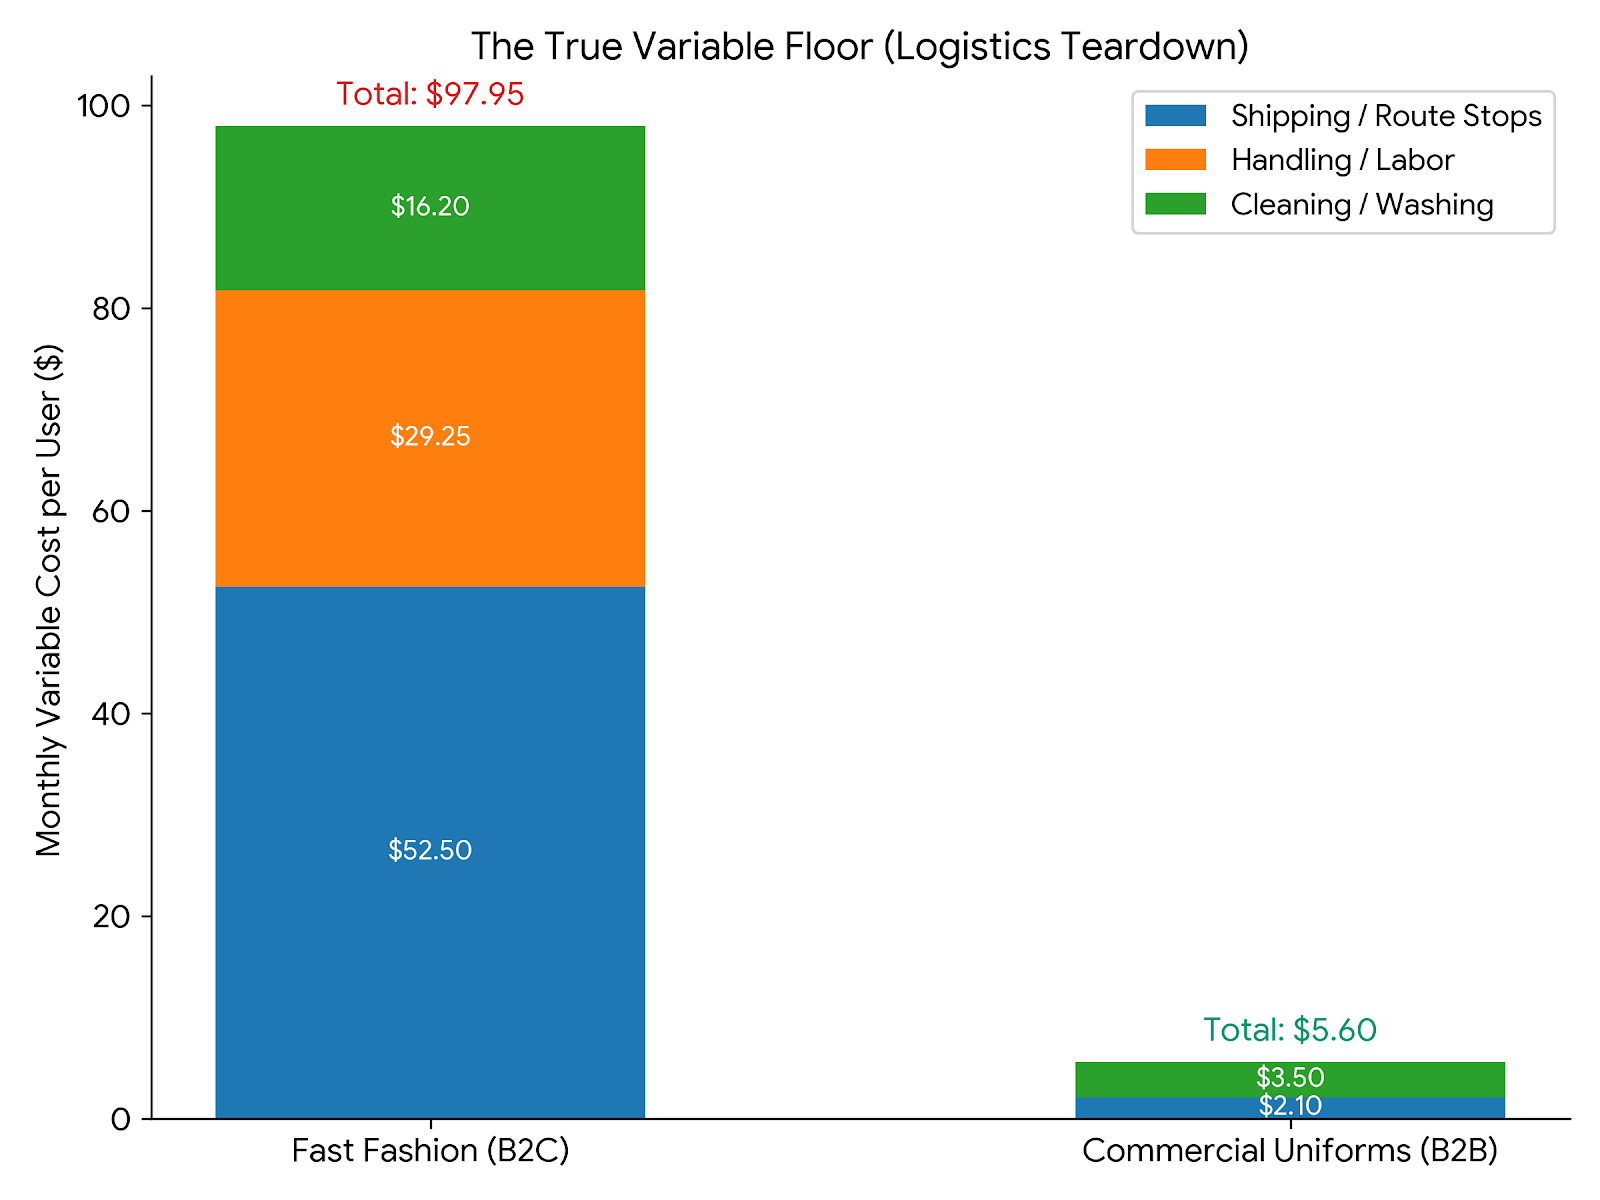
Since the user demands 3 boxes per month, your monthly logistics cost is $97.95. Against a $79 revenue ceiling, you are actively paying your customers $18.95 a month just for the privilege of doing their laundry and running their FedEx routes.
2. The Asset Depreciation Nightmare Then, we factor in the clothes. Fast fashion garments are not built to survive industrial shipping and cleaning. The average garment is ruined or "ages out" of trend after just 3 cycles.
At an average net cost of $135 per garment (after a 10% salvage value), the depreciation per wear is $45.00. A user getting 9 garments a month is effectively "burning" through **$405.00** of your inventory value every 30 days.
The B2C Bottom Line:
- Revenue: $79.00
- Logistics Cost: -$97.95
- Inventory Depreciation: -$405.00
- Net Unit Margin: -$423.95 per user, per month.
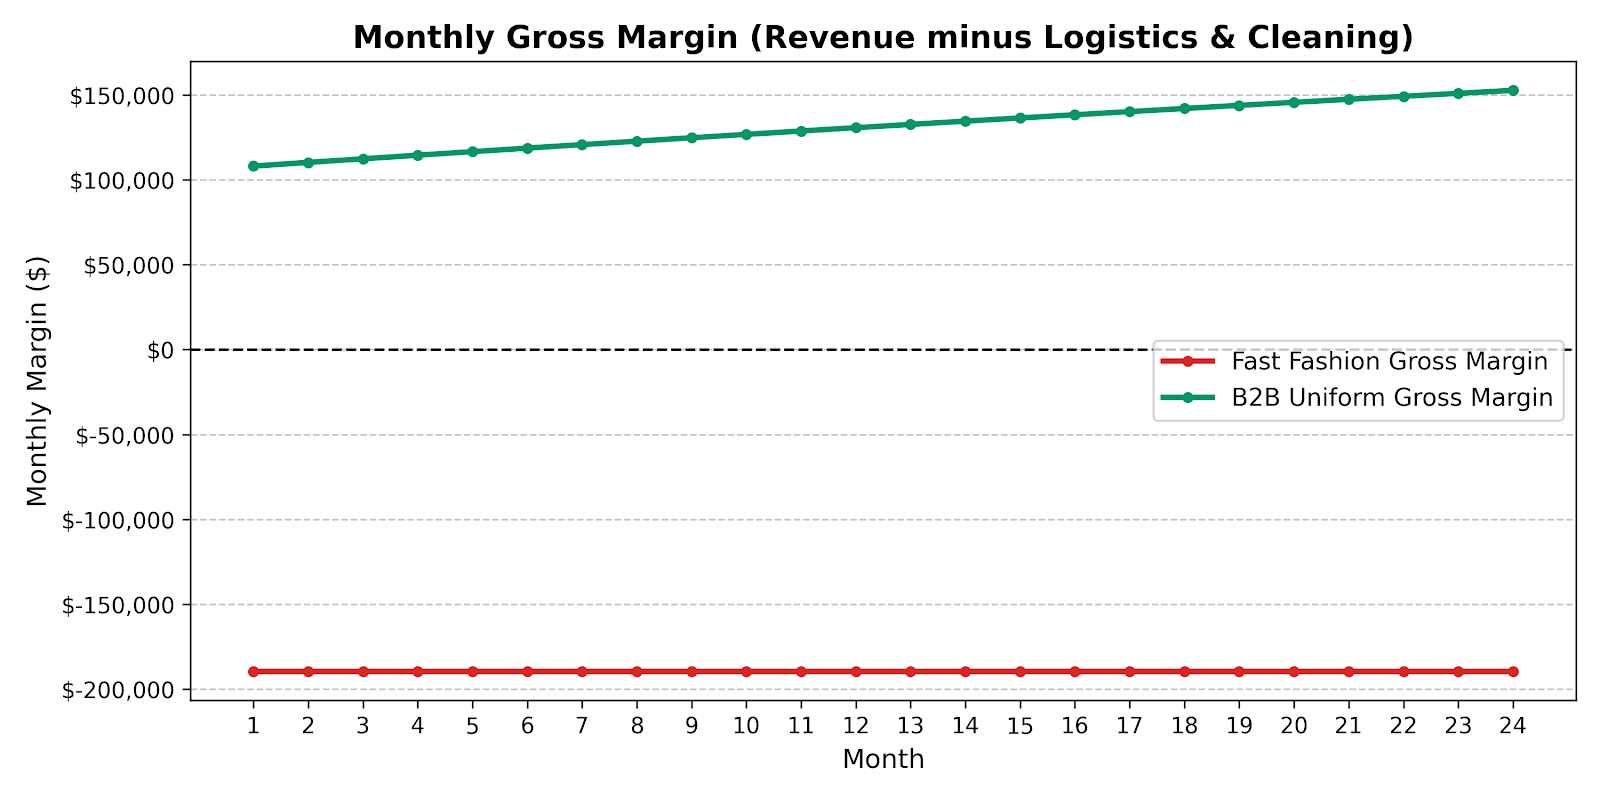
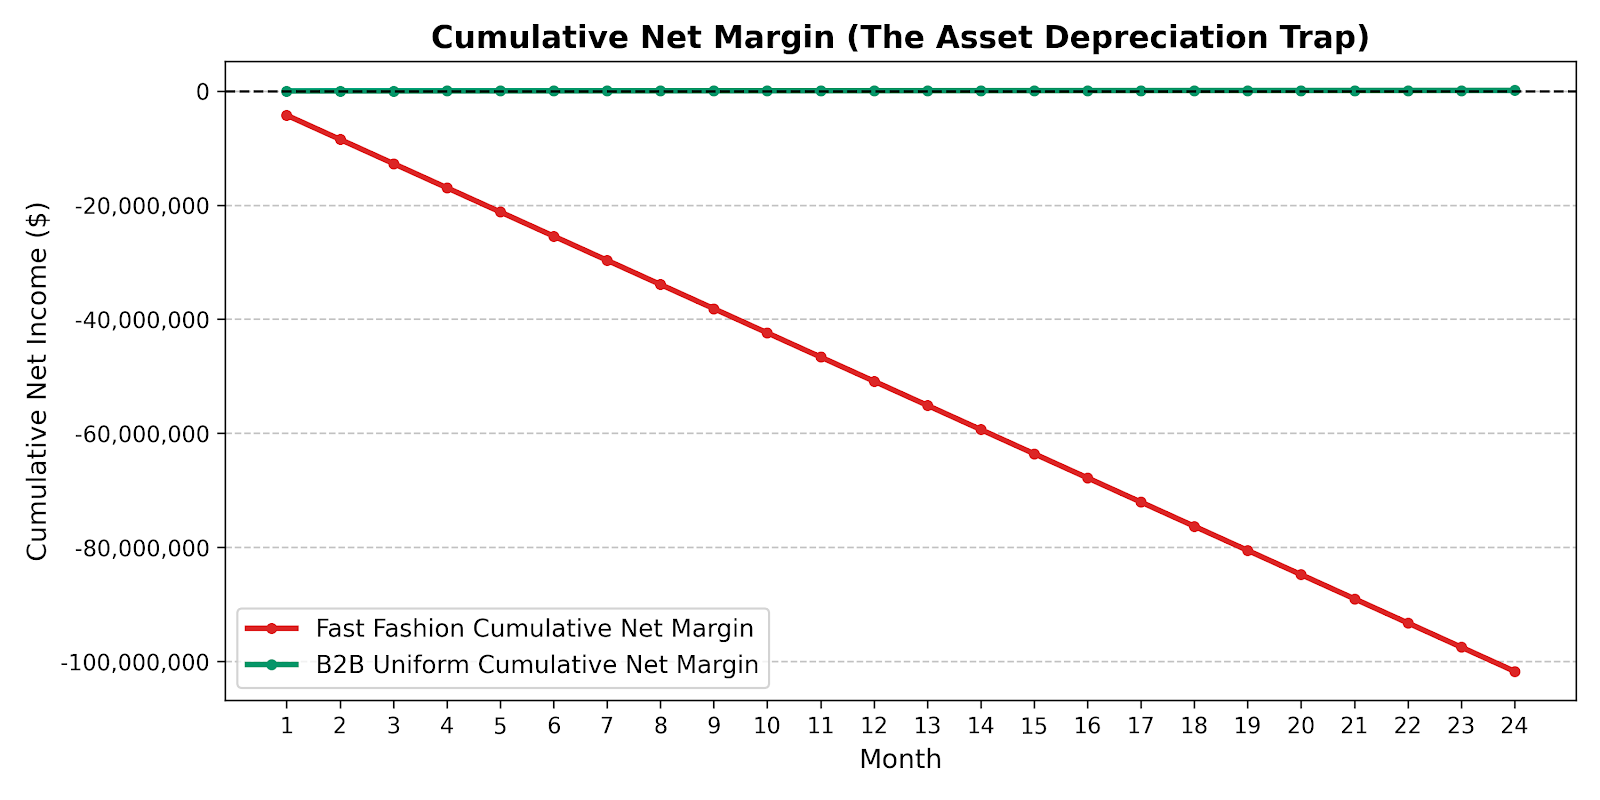
At a baseline of 10,000 active users with a 30% churn rate, this model actively bleeds over $4.2 million a month. Scaling this business does not create a unicorn; it accelerates a bankruptcy.
Part 2: The Architect's Litmus Test
Every physical subscription model is governed by a strict mathematical boundary. For the system to survive, the recurring revenue must strictly outpace the combined forces of variable logistics and asset destruction.
We use this formula to instantly audit operational viability:
The Asset-Velocity Viability Criterion
- ARPU: Average Monthly Revenue Per User/Account
- V: Monthly Velocity (Shipments or turnarounds per month)
- Cvar: Variable Logistics Cost per cycle (Shipping, cleaning, handling)
- Casset: Total Capital Cost of the inventory deployed to that user
- Lmonths: The maximum surviving lifespan of that inventory in months
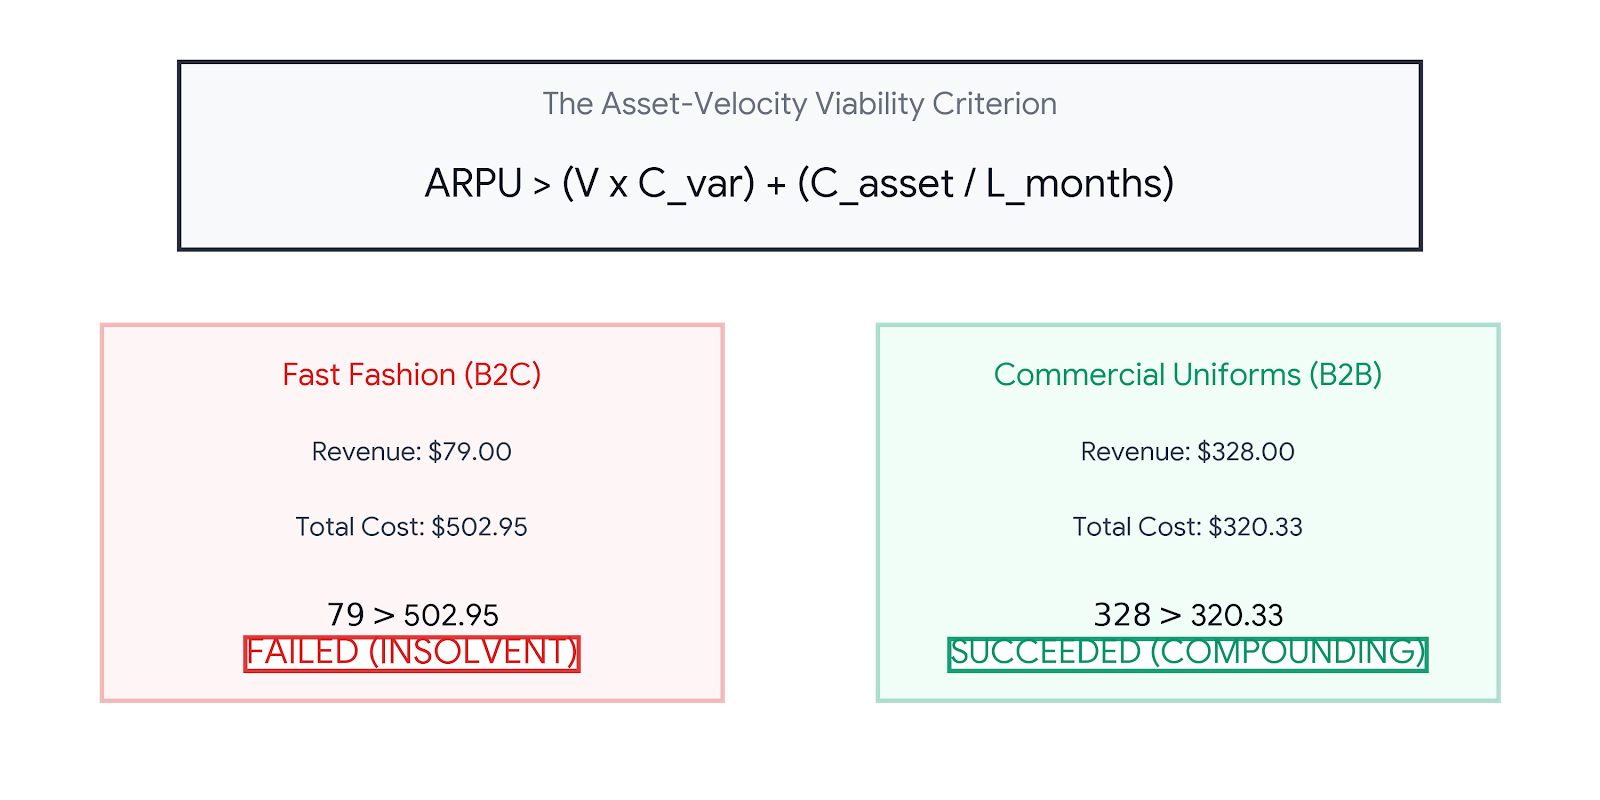
When we plug the B2C Fast Fashion numbers into the criterion: $79 > $97.95 + $405.00 The result is violently false. The system is structurally dead on arrival.
Part 3: The B2B Uniform Inversion
To save the architecture, we abandoned B2C entirely and pivoted to B2B Commercial Uniform Rentals.
We modeled a standard account: an auto shop with 20 employees, requiring 5 uniforms each (100 total garments), picked up and replaced every 1.5 weeks (2.8 deliveries per month) at a lease rate of $3.00 per garment.
This changed the physics of the business overnight:
- Route Density (Logistics): Instead of shipping 100 boxes to 100 residential addresses, one truck stops at one commercial location for a $15 internal cost.
- Bulk Processing: Individual $1.80 dry cleaning is replaced by massive tunnel-washers, dropping cleaning costs to $0.25 per garment.
- Asset Lifespan: Industrial workwear survives 50 to 70 cycles (24+ months), drastically slashing the monthly depreciation burden.
Let's run the B2B model through the Viability Criterion:
- Revenue: $328.00 (100 garments @ $3 + $28 in delivery fees)
- Logistics: $112.00 (Bulk washing + Truck stops)
- Depreciation: $208.33 *($5,000 Capital Cost / 24 months)*
- The Math:
$328 > $112.00 + $208.33
The result is True. The B2B model generates a fully burdened, positive margin from day one. And when that garment outlives its 24-month depreciation schedule, that $208/month falls straight to the bottom line as pure cash profit.
Part 4: "Skin in the Game" Economics
There was one final trap to disarm.
B2B uniforms require personalization—name tags, company logos, and embroidery. We calculated this would cost $5 per garment (an extra $500 upfront CapEx per account). Left unchecked, this pushed the inventory payback period to a dangerous 25.4 months—longer than the expected lifespan of the garment itself. The business would technically lose money.
Instead of eating the cost or raising the monthly lease, we introduced a one-time $5 Upfront Setup Fee on the client's first invoice.
This is what we call "Skin in the Game" Economics. Not only did the setup fee instantly neutralize our CapEx (pulling our payback period down to a highly profitable 23 months), but it forced the client to respect the inventory. When a business owner pays $500 upfront to outfit their crew, their management team ensures employees don't use the lease shirts to clean engine blocks.
We successfully outsourced our inventory protection to the client.
Part 5: The 24-Month Reality
When you compare the B2C and B2B architectures side-by-side over 24 months, normalizing the models to 10,000 active wearers, the power of structural inversion is undeniable.
The Unconventional Takeaway
High-breadth, high-velocity models look great in pitch decks, but physical reality always collects its toll. By shifting to a low-breadth, high-depth architecture, we neutralized churn, weaponized route density, and aligned our clients' financial incentives with our own asset preservation.
Don't market your way out of a math problem. Fix the physics of the business first.